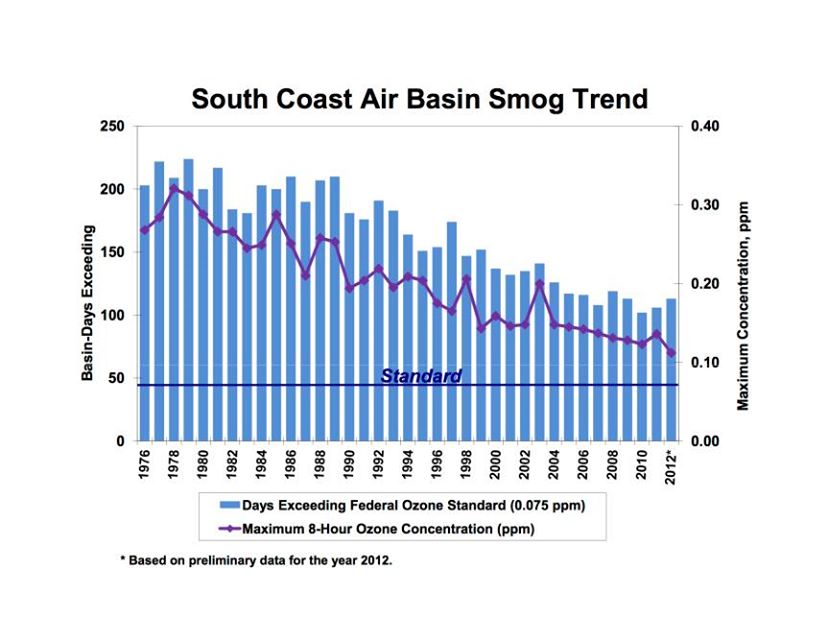
Interesting graph of LA smog trends from 1976 through 2012. Note the general downward trend despite the fact that we have *more cars* on the road now than we did 40 years ago.
Source: Q&A: 25 years and counting of Metro Rail, part two
Comment from Tal: