Yesterday’s California power demand vs. forecast graph & how effective the 3pm Flex Alert was

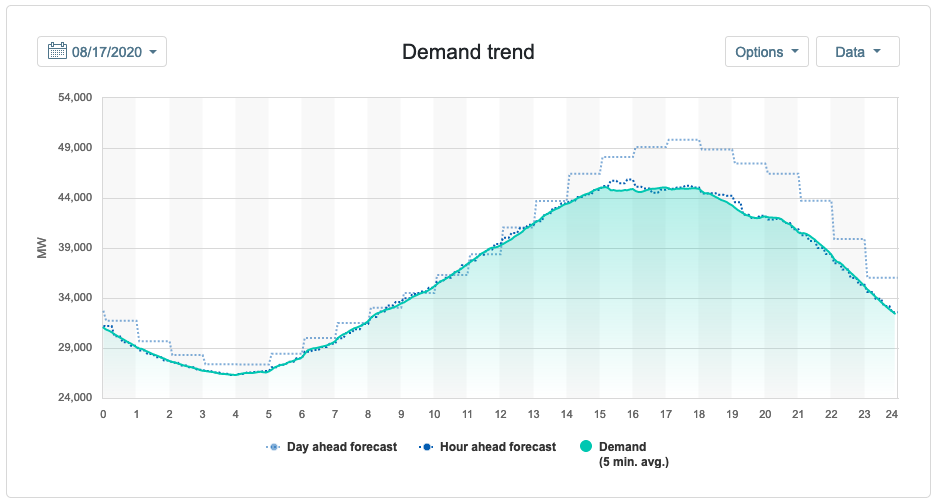
Fascinating to look at yesterday’s California power demand vs. forecast graph & how effective the 3pm Flex Alert was at getting people to reduce power usage during peak hours. (That forecast demand peak was very close to the forecast supply peak.)

https://www.caiso.com/TodaysOutlook/Pages/default.aspx

Graph showing hour-by-hour power demand for August 17, forecast tracking a sine wave dipping to around 26K MW at 4am & peaking at 49K at 6pm. Actual usage tracks until 3pm, when it flattens, then stays below the forecast curve for the rest of the evening.

On Wandering.shop
On Twitter