I’m normally not nervous about going to the dentist, but I’ve got my second pandemic-era visit coming up today. You can’t wear a mask while someone’s working on your teeth.
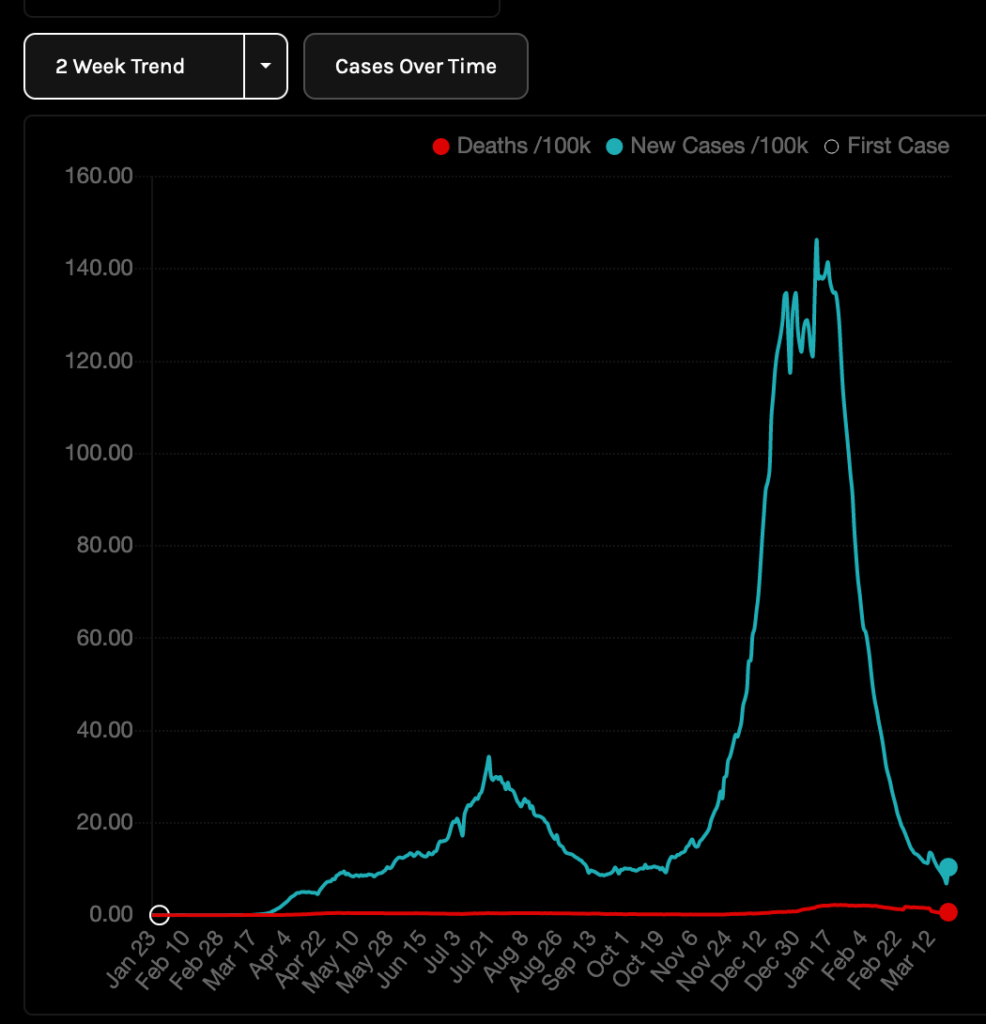
On the plus side, looking at the covid case rates over time makes me feel better, as LA county is back down to roughly the same rate it was at during my last visit in September (itself postponed from July, which was clearly a good decision).